Preparation
To test the the light sensors we used 2 gray bar images(shown below, they will be referred to as respectively step8 and step15).

 The color of each color bar is shown in the spreadsheet below(the id refers to the number printed on each bar in the images and the color value of each bar is rounded ):
 The images were printed on a A4 paper with a standard laser printer, which made the quality of the print a bit noisy. The images were stretched to fill out almost the hole paper, so the bars were as big as possible.
Measuring the sensors
Method
The sensors were placed on the car at their final positions, so there is no error in the angle or distance to the surface below the sensor.
Both tests where made by moving the car around, so one sensor at a time where measured at each bar in the images. Below is a image of the car measuring one of the sensor values on one of the color bars.

To run the test the following code were implemented in the NXT. It use the 3 color sensors and write their values to the LCD.
----------------------------------------------------------------------------------------------------------------------------
import lejos.nxt.*;
public class SensorTest{
public static void main(String [] args) {
LightSensor light1 = new LightSensor(SensorPort.S1);
LightSensor light2 = new LightSensor(SensorPort.S2);
LightSensor light3 = new LightSensor(SensorPort.S3);
while (! Button.ESCAPE.isPressed())
{
LCD.clear();
LCD.drawString("S1: ",0,0);
LCD.drawInt(light1.readValue(), 3, 4, 0);
LCD.drawString("S2: ",0,1);
LCD.drawInt(light2.readValue(), 3, 4, 1);
LCD.drawString("S3: ",0,2);
LCD.drawInt(light3.readValue(), 3, 4, 2);
LCD.refresh();
try { Thread.sleep(100); } catch (Exception e) {}
}
LCD.clear();
LCD.drawString("Program stopped",0,0);
LCD.refresh();
} }
----------------------------------------------------------------------------------------------------------------------------
Expectations
We hope there is a linear function between the color value printed on the paper and the value we measure, because it will make the conversion easy. If not we may see if the error is small enough to be neglected.
Results
The measurements gave the following result:
 The results of the measurement on the step15 image are plotted on the following figure.
 By looking at the measured values it was obviously that the sensor could not distinguish the difference between the light gray colors - There is almost no difference between the last 3 values of each sensor. In the other end the black have a large jump to the next color bar compared to the other steps.
It's clear that light sensors gets different measurements for the same color. Which means that we have to implement a function for each light sensor.
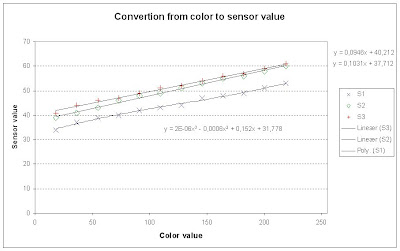
On this background we had to estimate a function to convert a color to a sensor value. To do this we omitted the first value and the 2 last color bars and then made Microsoft Excel try to give us different functions as seen below.

We tried to make a linear function for the conversion, but it was not accurate enough.
So we tried with a polynomial estimation, but still it failed to be accurate enough. So we ended up with the conclusion that we have to use a piecewise linear function, with one piece between every measurement.
Another thing about these results is that 15 levels may have too little difference to be distinguished. So a little less may be prefferred.
Conclusion
It was not possible to make a linear function to convert a color value to a sensor value, so we ended up using a piecewise linear function.
The sensor can not distinguish the light colors from each other. So these cannot be included in the color range used in a map.
No comments:
Post a Comment